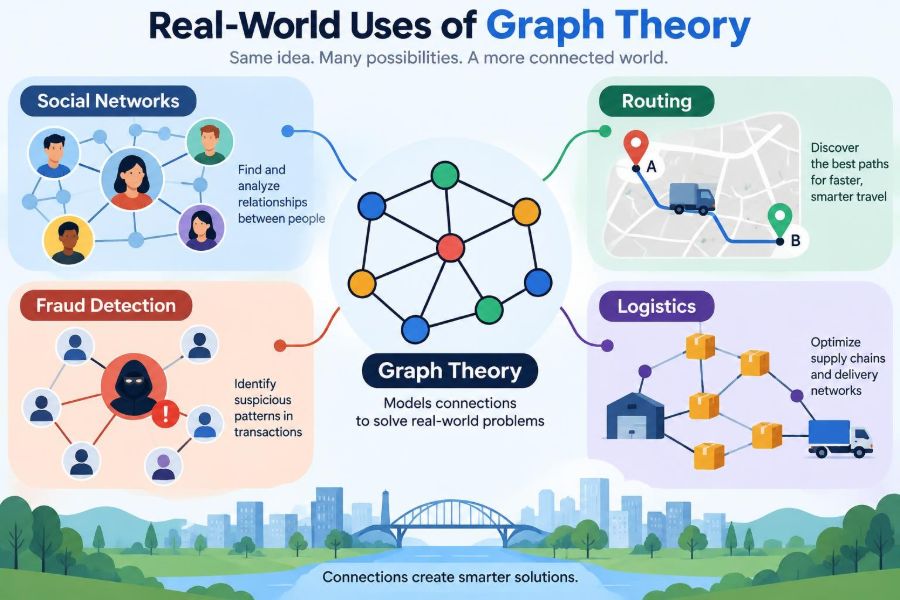

You open a map app to avoid traffic, receive a friend suggestion on a social platform, or track a package as it moves through several warehouses. These features seem unrelated, yet they often rely on the same mathematical idea.
That idea is graph theory: the study of connections. It gives computers a way to represent people, roads, transactions, devices, shipments, and many other systems as networks that can be searched and analyzed.
Graphs help answer practical questions: Who is connected to whom? What is the fastest route? Which account behavior looks unusual? Where is a supply chain likely to slow down?
The mathematics can become advanced, but the central model is approachable. Once you see a graph as a map of relationships, many real-world computer systems become easier to understand.
🧩 What a Graph Represents
A graph is made of vertices (also called nodes) and edges. A vertex represents an entity, while an edge represents a relationship or possible connection.
For a road system, intersections can be vertices and road segments can be edges. In an online network, accounts are vertices and follows, friendships, or messages may be edges.
🔗 Nodes and Edges in Everyday Systems
The same graph structure can describe very different domains because it focuses on relationships rather than the physical nature of the objects.
- A person connected to friends
- A router connected to network links
- A warehouse connected to delivery routes
- A bank account connected to transfers
- A web page connected to hyperlinks
Choosing what counts as a node and what counts as an edge is one of the most important design decisions in a graph-based system.
➡️ Directed and Undirected Connections
An undirected edge means the relationship works both ways. A mutual friendship is often modeled this way: if A is friends with B, B is friends with A.
A directed edge has an arrow. A follows B does not necessarily mean B follows A. Payments, web links, and one-way streets are also naturally directed.
⚖️ Weighted Edges Add Meaning
Many edges carry a value called a weight. A route edge might store distance, travel time, toll cost, or estimated fuel use.
In a communication graph, weight might represent bandwidth or delay. In a social graph, it might estimate interaction strength from messages, comments, or shared activity. The chosen weight determines what “best” means to an algorithm.
🗺️ A Graph Is Not Always a Geographic Map
Road networks look like maps, but graphs need not describe physical space. A transaction graph may connect accounts located in different countries, and a knowledge graph may connect concepts with no geographic position at all.
This distinction matters because a short graph path does not always mean short physical distance. Two people can be only two social connections apart while living far away.
🧭 Paths Answer Movement Questions
A path is a sequence of edges that takes you from one node to another. Finding paths is central to navigation, data delivery, dependency analysis, and recommendation systems.
A path can be optimized for different goals. A delivery firm may prefer the least expensive path, while an emergency dispatch system may prioritize the quickest reliable path.
🏁 Shortest Path Does Not Always Mean Fastest
“Shortest path” is an algorithmic term: it means the path with the smallest total weight. If every road is weighted by kilometers, it finds minimum distance. If weighted by predicted minutes, it finds minimum expected travel time.
This is why route quality depends heavily on current data. A path that is shortest in distance may be poor during congestion, road closures, or severe weather.
🚗 Routing in Navigation Apps
Navigation software can model roads as a directed weighted graph. One-way streets require direction; road lengths, speed estimates, restrictions, and turn penalties influence weights.
When conditions change, the system can update relevant weights and recompute a route. It usually does not need to treat every road as equally useful: local road structure and the destination narrow the practical search.
📡 Internet Routing as a Graph Problem
The internet is also a network of connected devices and networks. Data is broken into packets, and routing systems choose next steps toward a destination.
Unlike a single map route, internet routing must respond to failures and changing capacity. A link may be technically available but undesirable because it is congested, expensive, or unstable.
🔄 Resilience Through Alternate Paths
A valuable graph is not merely connected; it may have redundant paths. If one road, server, or fiber connection fails, another path can keep movement or communication going.
Network designers look for weak points where removing one node or edge separates a graph into pieces. In critical systems, those points may deserve backup equipment, alternate suppliers, or additional routes.
👥 Social Networks as Connection Graphs
Social platforms model users and their interactions as graphs. Depending on the feature, an edge may mean friendship, following, membership, a message, a reaction, or a shared event.
One platform can maintain multiple graphs because each relationship means something different. Treating every interaction as equally meaningful can produce poor recommendations and misleading conclusions.
🤝 Mutual Connections and Friend Suggestions
A simple friend-suggestion approach looks for people with many mutual connections. If two users share several friends, the system may infer a greater chance that they know one another.
This is a useful heuristic, not proof of a real relationship. Shared classmates, coworkers, or a large public community can create mutual connections without personal familiarity.
🧠 Communities and Clusters
A community is a part of a graph whose members connect more densely with one another than with the rest of the network. Communities can correspond to project teams, hobby groups, local circles, or topic audiences.
Detecting clusters helps systems organize large networks. It can support content discovery, team analysis, and network visualization, but labels should be interpreted carefully because human groups overlap and change.
🌉 Bridges Between Groups
Some nodes connect otherwise separate communities. These are often called bridge-like nodes because information, ideas, or traffic may pass through them.
For example, a person active in two professional communities may connect discussions that would otherwise remain separate. In a network, a bridge link can also be a resilience risk if no alternative connection exists.
⭐ Centrality Measures Influence
Centrality measures describe different kinds of prominence in a graph. High degree centrality means having many direct connections. Other measures focus on whether a node lies on many paths or is close to many other nodes.
These measures are useful for prioritization, but “central” does not automatically mean influential, trustworthy, or important in every context. A highly connected automated account, for example, may not represent meaningful social influence.
🛍️ Recommendations Through Graph Patterns
Recommendation systems can use graph relationships between users, products, artists, articles, and actions. If similar users engage with similar items, the system can identify nearby patterns in the graph.
A bookstore example might connect readers to books they rated or purchased. A reader who overlaps with a group of science-fiction fans may receive relevant suggestions, while diversity rules can prevent the list from becoming overly narrow.
💳 Transaction Graphs Reveal Relationships
Fraud detection often benefits from graphs because suspicious activity may be visible in relationships rather than in one transaction alone. Nodes can represent accounts, cards, devices, merchants, addresses, or phone numbers.
Edges can represent payments, logins, shared identifiers, or transfers. This allows analysts to examine networks of activity instead of reviewing isolated rows in a spreadsheet.
🔍 Patterns That May Merit Review
Graph analysis can surface patterns worth investigating, such as many newly created accounts sharing a device, unusual circular transfers, or a sudden link between previously unrelated account groups.
These patterns are signals, not verdicts. Families may share devices, legitimate businesses may move money among accounts, and unusual behavior can have ordinary explanations.
🕸️ Fraud Rings and Shared Infrastructure
Organized abuse often reuses infrastructure because creating unique devices, addresses, payment methods, and identities is costly. A graph can make shared components easier to see.
For instance, a hypothetical marketplace might find dozens of seller accounts connected through the same small set of payout details. That structure may justify further verification, not automatic accusations.
⚠️ False Positives Require Care
A false positive occurs when a legitimate person or activity is flagged as suspicious. In fraud systems, this can delay payments, block purchases, or create unfair friction for customers.
Good systems combine graph features with other evidence, confidence thresholds, human review for consequential cases, and clear processes for correcting errors. Accuracy must be balanced with customer impact and fairness.
📦 Logistics Is a Flow Network
In logistics, nodes can represent factories, ports, warehouses, stores, and customers. Edges represent shipping lanes, truck routes, rail links, or air connections.
The challenge is broader than finding one route. Companies must coordinate capacity, inventory, delivery deadlines, vehicle limits, and disruptions across the whole network.
🏭 Warehouses as Network Hubs
A warehouse often acts as a hub: goods arrive from many sources and leave toward many destinations. Hub placement can reduce overall travel, but concentrating too much activity in one location can create congestion or vulnerability.
A network may instead use several regional facilities. This can shorten last-mile deliveries and improve resilience, though it may increase inventory coordination costs.
🚚 Last-Mile Delivery Has Different Constraints
The last mile is the final movement from a local facility to the customer. It is graph-based, but it also involves delivery windows, vehicle capacity, parking, service time, and changing customer availability.
Route planning may therefore solve a version of the vehicle routing problem: assign stops to vehicles and order each route while meeting operational constraints. It is more complex than simply finding one shortest path.
📊 Flow and Capacity Bottlenecks
Some graph problems ask how much can move from a source to a destination. In a supply chain, every edge can have a capacity, such as the number of containers a route can handle or the volume a facility can process.
A bottleneck is a limited connection that constrains the whole system. Adding capacity elsewhere may have little effect if the bottleneck remains unchanged.
🌪️ Disruptions Propagate Across Networks
A closure at a port, a failed distribution center, or a blocked road can affect distant locations when many paths depend on it. Graph models help planners estimate which customers, products, or routes are exposed.
They do not eliminate uncertainty. Demand shifts, weather, and supplier decisions can change quickly, so planning should consider multiple plausible scenarios rather than one forecast alone.
🧮 Common Algorithms Behind the Scenes
Different questions call for different graph algorithms. Breadth-first search explores nearby nodes layer by layer and is useful when every edge has equal cost. Depth-first search follows one branch deeply and is useful for traversal and structural checks.
Dijkstra’s algorithm finds shortest paths when edge weights are nonnegative. More advanced approaches handle special constraints, very large graphs, or repeated route queries. The right choice depends on data size, edge meaning, and required response time.
🗃️ Graph Databases Store Connected Data
Traditional relational databases organize information in tables. They are excellent for many business tasks, but queries involving many relationship hops can become cumbersome.
A graph database stores nodes, relationships, and properties directly. It can be a practical fit when questions repeatedly involve traversing connections, such as “Which devices are linked to accounts connected to this transaction?”
🔐 Privacy Changes the Design
Connection data can be sensitive even when it does not include message content. A pattern of contacts, locations, purchases, or shared devices may reveal private aspects of someone’s life.
Responsible graph systems should collect only data needed for a legitimate purpose, control access, protect stored information, and avoid using relationship inferences beyond what users reasonably expect.
⚖️ Bias Can Travel Along Edges
Graph-based decisions can reproduce existing inequalities when past connections reflect unequal access, exclusion, or biased enforcement. For example, a model trained on historical investigations may learn patterns shaped by earlier human choices.
Teams should test outcomes, inspect influential features, document limits, and ensure that high-impact decisions have appropriate safeguards. A technically sophisticated graph model is not automatically a fair one.
🧪 Start With a Clear Question
Graph projects often fail when teams build a large network without deciding what decision it should improve. Begin with a question such as: “Which deliveries are most exposed to a route closure?” or “Which accounts share unusually strong transaction links?”
Then define nodes, edges, direction, weights, time windows, and success criteria. This prevents attractive visualizations from being mistaken for useful analysis.
🕒 Time Is Part of Many Graphs
Real networks change. A friendship may become inactive, a route may close, and a transaction link may exist only for a few minutes. A graph that ignores time can combine old and new behavior in misleading ways.
Temporal graphs attach timestamps or maintain snapshots. In fraud analysis especially, the order and speed of events can matter as much as the connections themselves.
🧹 Data Quality Shapes Results
Duplicate identities, missing addresses, outdated routes, and inconsistent naming can distort a graph. If two records for the same warehouse are not matched, a system may invent a false separation in the supply network.
Data cleaning, entity resolution, and clear definitions are not minor preparation steps. They determine whether graph algorithms operate on a credible representation of reality.
📈 Visualizations Help, but Can Mislead
Network diagrams are useful for spotting clusters and explaining relationships. However, large graphs quickly become dense “hairballs” where every line competes for attention.
Filter the view around a question, show meaningful labels, and summarize patterns with metrics when appropriate. A visualization should support investigation, not replace it.
🛠️ A Practical Workflow for Graph Problems
- Define the decision or question.
- Identify entities as nodes and meaningful relationships as edges.
- Decide whether edges are directed, weighted, and time-dependent.
- Check data quality and privacy requirements.
- Select an algorithm or metric that matches the question.
- Validate results against real cases and monitor errors.
This workflow keeps the focus on operational value instead of treating graph theory as an isolated mathematical exercise.
🎯 The Core Principle of Graph Theory
Graph theory is powerful because many difficult problems are really problems of relationships. Social recommendations depend on connections among people; routing depends on connections among places; fraud review depends on connections among events and identities; logistics depends on connections among facilities and routes.
The graph itself does not make decisions for us. Its value comes from modeling the right relationships, assigning meaningful costs or capacities, and interpreting results with domain knowledge, caution, and human judgment.
When the connections matter as much as the individual items, graph theory provides a practical language for seeing the system as a whole. That perspective turns scattered records, roads, transactions, and shipments into a network that can be explored, improved, and managed responsibly. 💻🕸️🚚