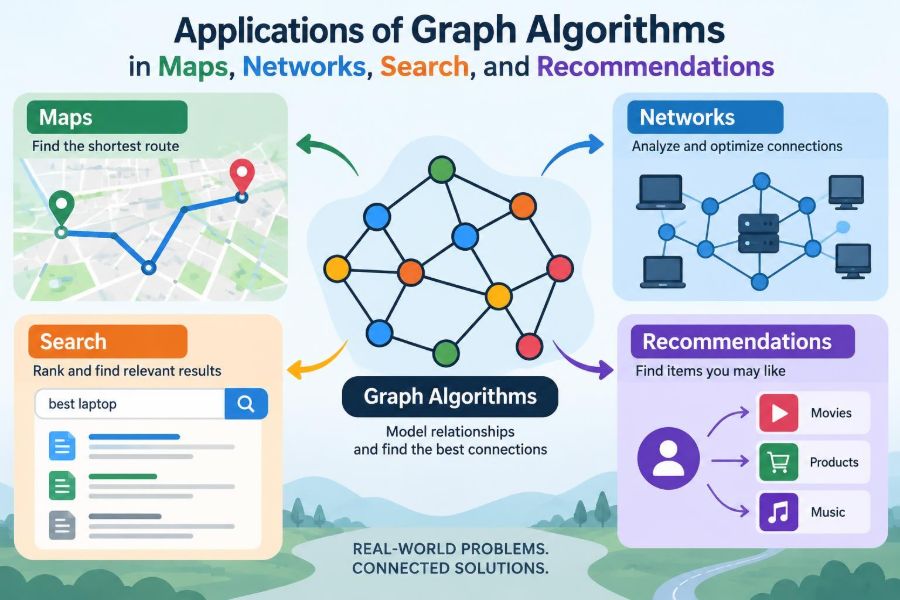

A navigation app finds a route around traffic. A social platform suggests someone you may know. A search engine decides which pages are most useful for a query. A streaming service offers a film that fits your recent choices.
These systems appear very different, but many share one powerful model: a graph. Graphs let software represent things and the relationships between them, then use algorithms to find efficient routes, detect meaningful patterns, rank choices, or make recommendations.
The idea is approachable. Think of a city map: intersections are points, roads connect them, and each road may have a travel time. Once that map becomes a graph, an algorithm can reason about millions of possible journeys without checking every route blindly.
Graph algorithms matter because real systems are connected. Learning how they work reveals why a route can change mid-trip, why networks can fail in surprising ways, and why a recommendation may be useful—or oddly wrong.
🧩 A Graph Is a Model of Connections
A graph consists of vertices, also called nodes, and edges, which connect pairs of nodes. A node can represent an intersection, person, web page, computer, product, airport, or task.
An edge represents a relationship. It may mean “there is a road,” “these people are friends,” “this page links to that page,” or “this customer bought this item.” The same mathematical structure can therefore describe many different problems.
🔗 Nodes and Edges Carry Meaning
A graph is only useful when its parts match the question being asked. In a road network, nodes are often intersections and edges are road segments. In a recommendation system, nodes might include both users and products.
Choosing the wrong meaning can produce misleading results. If every city is one node and every highway is one edge, a route planner cannot distinguish a fast route from a congested one unless it also stores useful information on those edges.
↔️ Directed and Undirected Relationships
An undirected graph has connections that work both ways. A mutual friendship or a two-way walking path can be modeled this way. If A connects to B, B also connects to A.
A directed graph gives every edge a direction. A one-way street goes from one intersection to another, a web page links outward to another page, and a person may follow an account without being followed back.
Direction is not a small detail. Ignoring it could make a mapping application suggest driving the wrong way down a one-way street.
⚖️ Weights Turn Connections into Decisions
Many edges have a weight: a number representing cost, distance, time, risk, capacity, or another quantity. A route planner may attach estimated travel time to each road. A network may attach latency, the delay in sending data, to each link.
The best path is not always the one with the fewest edges. Two short road segments can take longer than one highway segment, just as a flight with fewer stops may cost more than a longer itinerary.
🗺️ Maps Are Graphs with Geography
Digital maps add location data to a graph. Nodes have coordinates, while edges describe segments that vehicles, cyclists, or pedestrians can use. Attributes can include road type, speed restrictions, turn restrictions, tolls, and access rules.
Geography also creates practical complications. Roads cross visually on a map but may not connect if one is a bridge above another. A reliable map graph must preserve that difference.
🚗 The Shortest-Path Problem
The central routing task is often called the shortest-path problem: find a path from a starting node to a destination whose total weight is smallest. “Shortest” may mean fewest kilometers, least travel time, lowest fuel use, or fewest transfers.
Consider a hypothetical commute with three possible routes. The route with the least distance may pass through slow local streets, while a slightly longer route on a highway may minimize travel time. The chosen objective determines the answer.
📍 Dijkstra’s Algorithm for Nonnegative Costs
Dijkstra’s algorithm solves shortest-path problems when edge weights are not negative. It begins at the source, repeatedly selects the not-yet-finalized node with the lowest known cost, and relaxes its outgoing edges.
To relax an edge means checking whether traveling through the current node improves the best known cost of a neighbor. Once the algorithm finalizes a node under its assumptions, it has found the best cost to reach it.
This makes Dijkstra’s algorithm a foundation for many routing situations, although large mapping systems use additional techniques to answer requests quickly.
🧭 A* Uses a Goal-Oriented Estimate
A*, pronounced “A star,” improves on basic exploration when a specific destination is known. Along with the cost already traveled, it uses a heuristic: an estimate of the remaining cost to the target.
For a road map, straight-line distance is a useful estimate of remaining distance. It encourages the search to focus toward the destination rather than spread equally in every direction.
A heuristic must be chosen carefully. If it overestimates in a setting where guaranteed optimality is required, A* can prefer a route that is not actually best.
🚦 Dynamic Traffic Changes Edge Weights
A road does not have one permanent travel time. Congestion, construction, incidents, weather, and time of day can change it. Navigation services update or estimate edge weights as conditions change, then recalculate routes when a different path becomes preferable.
This explains why an app may ask a driver to leave a familiar highway. It is not necessarily finding a physically shorter road; it is optimizing the current model of travel time.
Predictions are still uncertain. A route based on recent traffic data can be disrupted by an event that has not yet appeared in the data.
🚌 Multi-Modal Routing Adds Constraints
A journey may combine walking, cycling, buses, trains, and ride services. The graph must then represent transfer points, departure times, fares, accessibility features, and waiting periods.
For public transport, an edge may only be usable at certain times. A route that looks good in a simple distance graph may be impossible after the last train has departed. This is why timetable-aware routing is more complex than ordinary road routing.
🌐 Computer Networks Also Need Routes
In a communication network, routers and switches can be represented as nodes, and physical or logical links as edges. The task is to send data from a source to a destination through a path that satisfies performance and reliability needs.
Network routing does not always mean “find the shortest cable.” It may balance delay, bandwidth, monetary cost, link policies, and resilience. A path with an extra hop can be preferable if it avoids a congested or unreliable link.
📦 Packets Can Take Different Paths
Internet data is usually divided into small units called packets. Routers use forwarding information to choose where packets should go next. The full route is built one decision at a time rather than necessarily planned by one central machine.
Different packets in the same communication may sometimes travel through different paths. At the destination, higher-level protocols may handle ordering and recovery when needed. This design helps large networks adapt, but it also makes behavior less predictable than a single fixed route.
🛠️ Routing Protocols Share Network Knowledge
Routers need a way to learn which paths exist. Some routing approaches exchange information about distances to destinations; others distribute a view of the network’s links so each router can compute paths locally.
The key challenge is change. When a link fails, routers must update their decisions without creating long-lived loops, where traffic circles between devices. No routing method eliminates every trade-off between speed of updates, overhead, and stability.
🧱 Redundancy Makes Networks More Resilient
A network with only one route between important points has a single point of failure. If one link or router breaks, communication can stop. Additional edges create alternate paths.
Redundancy costs money and adds management complexity, but it is essential in systems where outages are costly. Graph analysis can identify weak points before a failure occurs and help engineers decide where an additional link provides the most value.
✂️ Bridges and Articulation Points Reveal Fragility
In graph terminology, a bridge is an edge whose removal disconnects part of an undirected graph. An articulation point is a node whose removal does the same. These concepts apply beyond networks.
A single bridge across a river, a key router between office branches, or a lone service connecting two software components can act as a bottleneck. Identifying these structures supports contingency planning instead of discovering dependence during an outage.
🔍 Search Can Be Viewed as Graph Traversal
Search is often a graph problem. A search engine can treat pages as nodes and hyperlinks as directed edges. A knowledge system can treat concepts as nodes connected by relationships such as “is a type of” or “was created by.”
Starting from a query, software may explore related nodes, collect candidates, and rank them. The graph alone does not understand language, but it supplies relationship signals that text-only matching would miss.
🌊 Breadth-First Search Finds Nearby Connections
Breadth-first search, or BFS, explores a graph in layers. It visits all immediate neighbors first, then neighbors two edges away, then the next layer. In an unweighted graph, it finds paths with the fewest edges.
For example, a social platform could use BFS to identify people one, two, or three connection steps away. In a troubleshooting tool, it could discover devices reachable within a small number of network hops.
BFS is valuable when each connection has equal cost. It is not the right choice for a map where one road segment might take seconds and another might take an hour.
🕳️ Depth-First Search Explores a Branch Deeply
Depth-first search, or DFS, follows one branch as far as it can before backtracking. It is useful for checking reachability, finding connected components, detecting certain kinds of cycles, and organizing dependency tasks.
DFS does not promise the shortest route. Its strength is systematic exploration with relatively modest bookkeeping, especially when the question is “can this be reached?” rather than “what is the cheapest way to get there?”
⭐ Link Analysis Helps Rank Web Pages
A hyperlink can be interpreted as a signal that one page points to another, but not every link should count equally. Link-analysis methods spread influence through the graph, so a link from a well-connected, reputable part of the graph may contribute differently from a link on an isolated page.
PageRank is a well-known example of this general idea. Modern search systems use many signals beyond links, including relevance to the query, freshness, language, location, and protections against manipulation. Graph structure is useful, not a complete definition of quality.
🕸️ Knowledge Graphs Connect Facts
A knowledge graph stores entities and typed relationships: a person worked for an organization, a book has an author, or a city is located in a country. Types make relationships more meaningful than a generic “connected to” edge.
Such graphs can support richer search and question answering. A system can connect an ambiguous name to the relevant person by considering nearby facts, rather than relying only on matching a string of letters.
🎬 Recommendation Starts with Relationship Data
Recommendation systems model relationships among users, items, and actions. An action might be watching a film, saving an article, purchasing a product, giving a rating, or skipping a song.
Often this forms a bipartite graph, where one set of nodes is users and the other is items. Edges usually connect across the sets: a user interacted with an item. This structure makes shared patterns visible.
👥 Collaborative Filtering Finds Similar Patterns
Collaborative filtering recommends items using patterns across many users. If two people have overlapping interests, an item enjoyed by one may be a useful candidate for the other.
Suppose a hypothetical reader saves several introductory programming articles and another reader saves many of the same articles plus a practical database guide. The database guide may become a candidate recommendation, even if its title shares few words with the first reader’s history.
Similarity is not certainty. Shared behavior may reflect a short-term need, a gift purchase, or simple curiosity rather than a lasting preference.
🧮 Random Walks Capture Nearby Interest
A random walk is a conceptual process that moves from one node to a connected node according to chosen probabilities. In recommendation and ranking, variants of random walks can estimate which nodes are most reachable or influential from a starting point.
Starting at a user, a walk may visit items they engaged with, then other users connected to those items, and then new candidate items. The method naturally favors related areas of a graph while still allowing broader discovery.
🧊 The Cold-Start Problem Has Little Graph Data
New users and new items have few or no edges, creating the cold-start problem. A new account has no history, and a newly released product has not yet accumulated interactions.
Systems may use item descriptions, categories, stated preferences, or broadly popular choices until stronger signals appear. These approaches help, but they can be less personalized than recommendations based on a rich interaction history.
🫧 Feedback Loops Can Narrow Discovery
Recommendations influence what people see, and what they see influences future interaction data. This can create a feedback loop: already popular items receive more exposure, which produces more edges and reinforces their apparent importance.
Good systems often balance familiar relevance with exploration. They may reserve space for newer, diverse, or less obvious candidates. That balance is a product decision as well as an algorithmic one.
🔒 Graph Data Can Reveal Sensitive Relationships
Even when a graph does not store private message content, its structure can be revealing. Connections, locations, timing, purchases, and membership patterns can expose relationships or routines when combined.
Responsible graph systems minimize unnecessary data, control access, and consider whether an apparently harmless inference could affect a person. Privacy is not solved merely by removing names; patterns themselves may be identifying.
⚖️ Fairness Depends on Data and Objectives
Graph algorithms can inherit unequal patterns from the data they process. For example, a recommendation model trained mainly on past exposure may keep underexposed creators or products less visible. A ranking score can reflect historical connectivity rather than intrinsic merit.
There is no universal fairness setting. Teams need to define the relevant harms, inspect outcomes for different groups where appropriate and lawful, and recognize that optimizing clicks or travel time alone may conflict with broader goals.
📈 Scale Changes the Algorithmic Challenge
A graph with a few hundred nodes can often be explored directly. A graph representing roads, webpages, devices, or users at large scale may contain enormous numbers of edges. Memory use, update frequency, and response time become as important as the core algorithm.
Engineers may partition a graph across machines, precompute commonly needed paths, cache results, or use approximations. An approximate answer delivered quickly can be more useful than an exact answer that arrives after the decision is no longer relevant.
🧪 Choosing an Algorithm Starts with the Question
The right method follows the problem’s structure, not the trendiest algorithm. Ask what nodes and edges represent, whether edges are directed, what weights mean, and whether the result must be exact.
| Need | Useful approach | Typical condition |
|---|---|---|
| Fewest connection steps | Breadth-first search | All edges have equal cost |
| Lowest nonnegative total cost | Dijkstra’s algorithm | Weighted graph with nonnegative edges |
| Fast route to one known goal | A* | A trustworthy heuristic is available |
| Reachability or structural exploration | Depth-first search | Shortest path is not the main goal |
This is a starting guide, not a substitute for checking the assumptions of a real system.
⚠️ Common Modeling Mistakes
Most graph failures begin with a poor model rather than a flawed implementation. A technically correct algorithm can still answer the wrong question.
- Treating a directed relationship as two-way.
- Using distance when users actually care about time, cost, or accessibility.
- Assuming weights remain fixed despite traffic or network load.
- Ignoring unavailable edges, such as closed roads or expired transit departures.
- Equating graph proximity with trust, quality, or personal preference.
The remedy is to state the objective and constraints in plain language before choosing data structures or code.
🧑💻 A Practical Way to Build Graph Features
Start with a small, inspectable example. Draw a few nodes and edges, list what each attribute means, and manually verify the expected answer. This often exposes missing directions, bad weights, and unclear edge cases early.
- Define the decision the feature must support.
- Choose nodes, edges, directions, and weights that represent that decision.
- Select an algorithm whose assumptions fit the model.
- Test unusual cases: disconnected nodes, loops, missing data, and sudden updates.
- Measure real outcomes, including latency, accuracy, safety, diversity, or user control as relevant.
For high-impact uses, technical testing should be paired with review of privacy, fairness, and failure consequences.
🌟 The Core Principle: Connections Create Computable Insight
Graph algorithms do not magically understand cities, networks, documents, or people. They transform a carefully designed representation of connections into answers about routes, reachability, ranking, resilience, and likely relevance.
The central lesson is to match the graph to reality and match the algorithm to the decision. A route planner needs changing costs and legal road rules; a network needs resilience and policies; a recommender needs useful signals plus safeguards against narrow or intrusive outcomes.
When relationships are part of the problem, graph algorithms provide a disciplined way to turn those relationships into practical decisions. From the next route on your phone to the next article suggested to you, the graph behind the screen is often doing the connecting. 🗺️🔗💻